01 / An essay by Charlie Ellington
User testing
Users don't know what they want. Watch what they do.
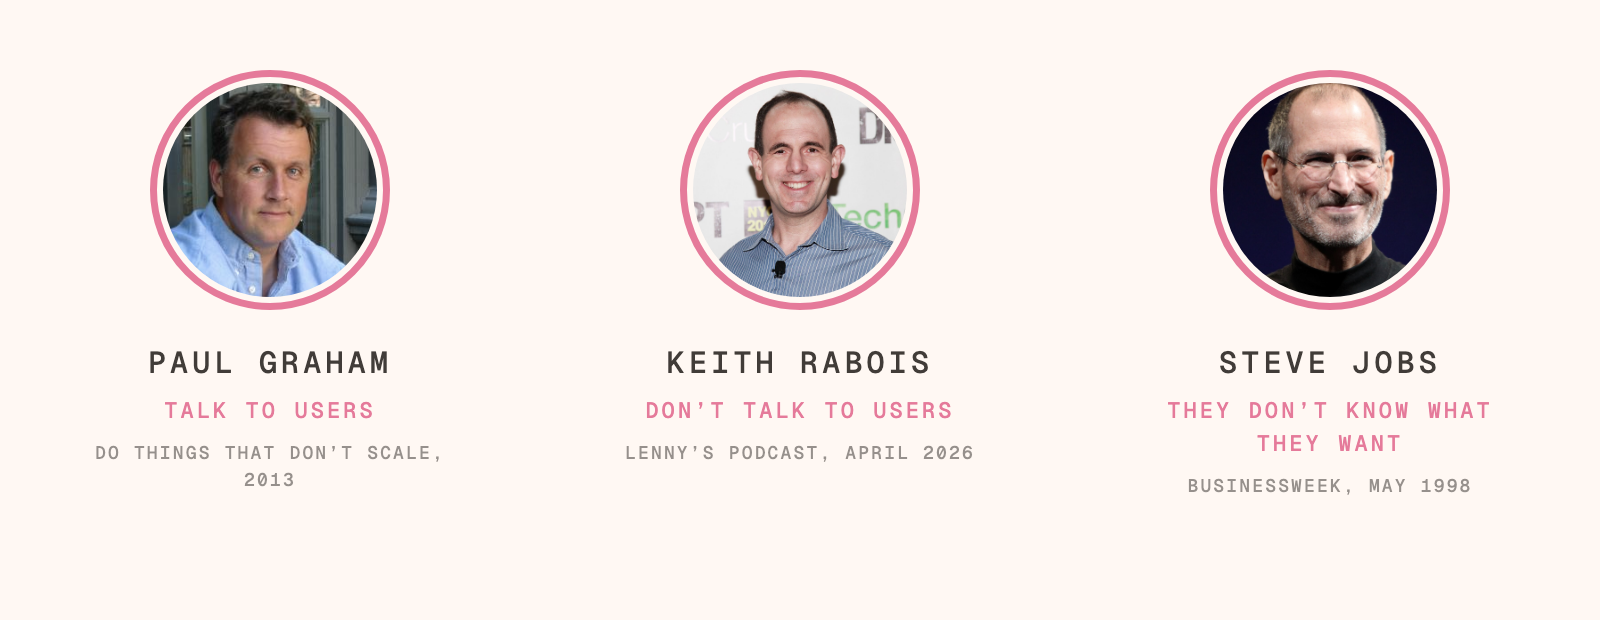
Three people worth listening to disagree.
Talk to users. Paul Graham, and all of Y Combinator behind him (Do Things That Don't Scale, 2013). "The feedback you get from engaging directly with your earliest users will be the best you ever get." Don't talk to users. Keith Rabois, on Lenny's Podcast this April. "I hate talking to customers. I refuse to allow colleagues of mine to talk to customers." Users don't know what they want. Steve Jobs, BusinessWeek, 1998. "A lot of times, people don't know what they want until you show it to them."
Three answers. All three are about the same thing, and it isn't the thing most people take from them.
Founders hear the last one and stop there. "I'm not going to talk to users. They don't know what they want." Which is ideal. Because what is actually going on is: "I've found supporting evidence that says I don't have to do the thing I don't want to do." And nobody wants to do it. Building is playing. Candid feedback is painful. A stranger frowning at the thing you made. And now an agent can build faster than you can book a call, so the trade looks even worse.
But this misses the point.
Users don't know what they want. True. What they do is the most useful information you can get.
Someone hesitates for fourteen seconds on the screen you thought was obvious. That's not an opinion. That's data. Someone opens the wrong menu and says "I thought it was here." That's a finding, with a timestamp. So: talk to users to see their behaviour. Just don't ask them what they want.
 Go back to the three quotes with that in mind.
Rabois isn't against watching. Listen to the whole segment: his argument is that buying is a subconscious decision, so when you ask, people rationalise. His example is asking someone why they bought a Porsche. "99% of the time they will tell you every reason except the real reason." That's an argument against asking. Watching is the opposite of asking.
Jobs' line gets cut short every time it's quoted. The sentence before it: "We have a lot of customers, and we have a lot of research into our installed base." He was against focus groups. "Until you show it to them" is an instruction to put the thing in front of people.
And YC now says it outright. Gustaf Alströmer, Startup School 2023: "You want to deeply understand their behavior, not just what they're saying but what they're doing."
Jakob Nielsen wrote the first rule of usability in 2001, and the title is the whole argument. Don't listen to users. "Watch what people actually do. Do not believe what people say they do. Definitely don't believe what people predict they may do in the future."
"What about just using the data?" Early stage, you don't have any. Ten sign-ups is not a funnel. It's ten people.
And analytics tells you what happened. It never tells you why. A person can. Better: a person can answer the follow-up question, and the follow-up question is more data.
Segment's founders learned this in a classroom. Their first product's dashboard looked fine. They sat at the back of a real lesson and watched the students ignore it. "If we had just observed the students, we would have known instantly."
"Isn't a thousand rows still better than five people?" Jakob Nielsen ran the numbers in 2000. Five users find about 85% of the usability problems in a design. The fifteenth user mostly shows you what the first five did.
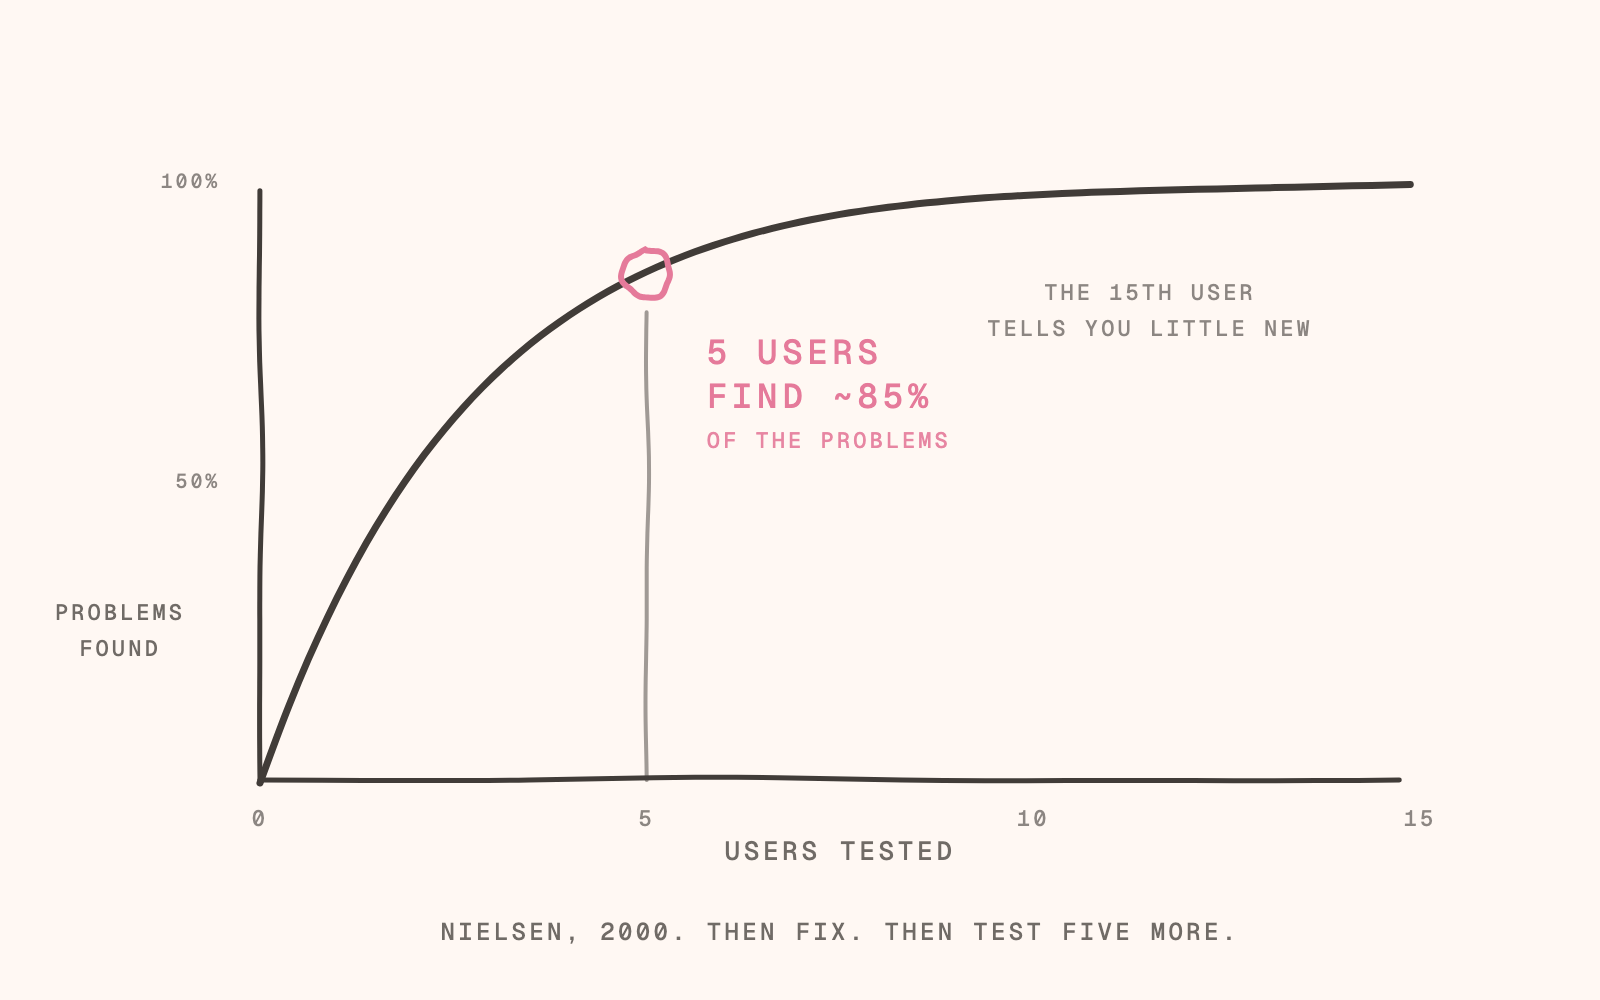
His advice for the money you'd spend on fifteen: "3 studies with 5 users each." Test five. Fix. Test five more.
You don't need a sample. You need five people who look like your customer, one at a time, with the thing in front of them.
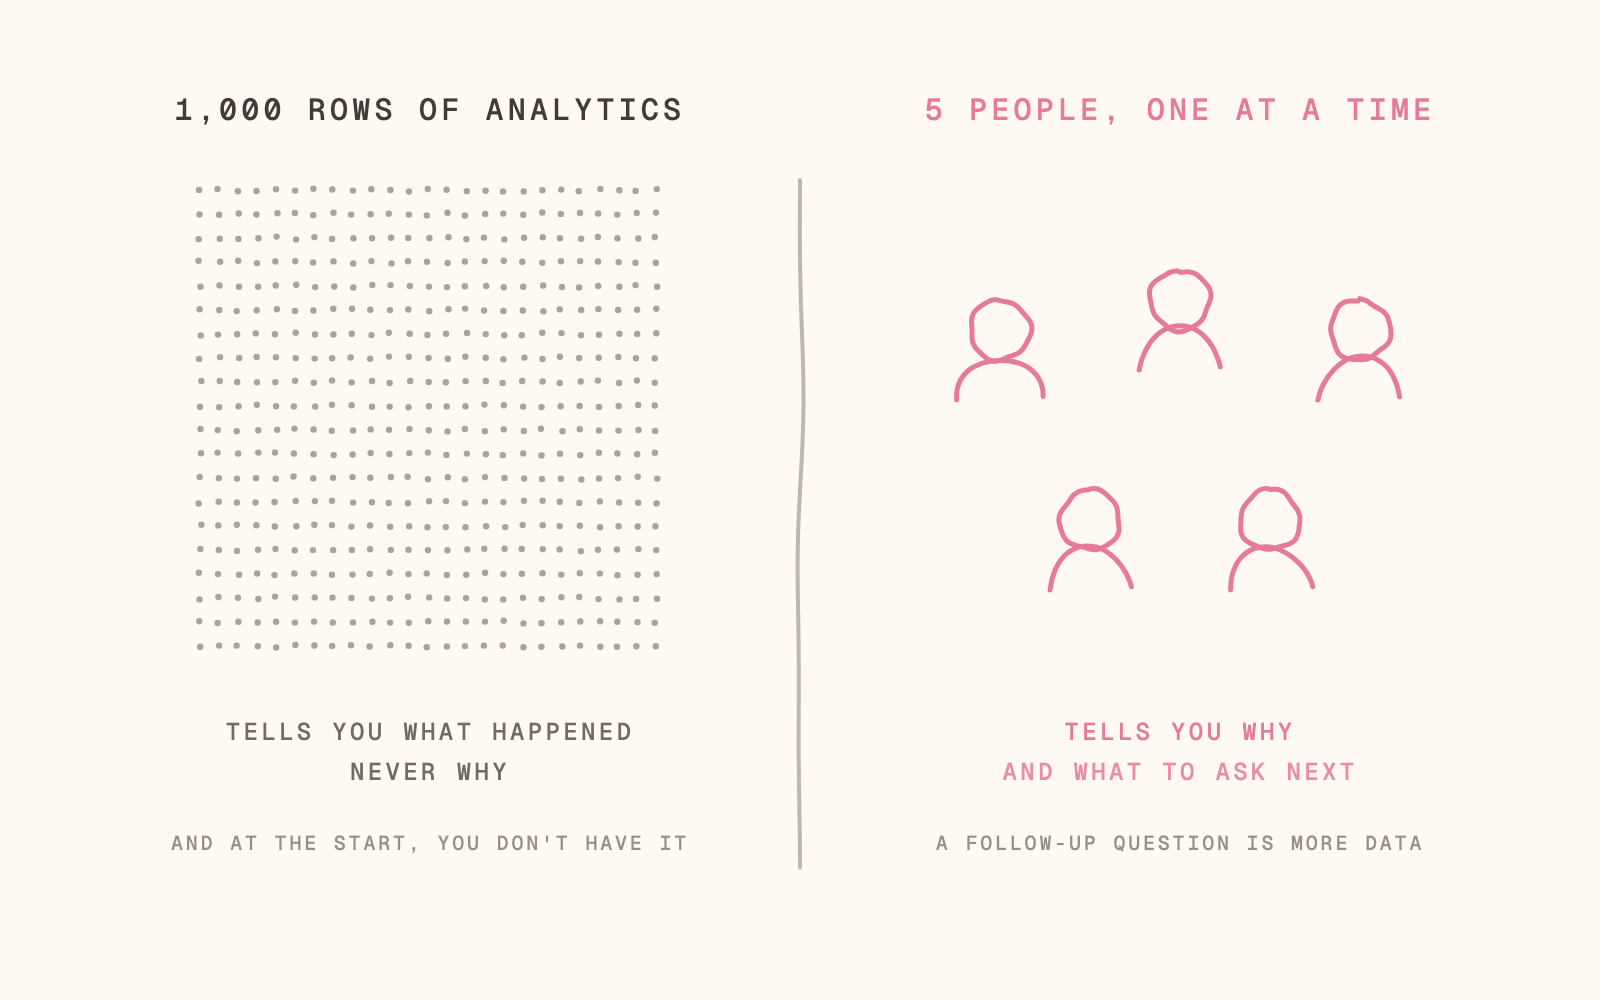
I've done this on more than fifty products. Five people or more in front of every one, every round. I've never once needed a thousand.
Two of mine. An AI due-diligence product for investors, January. Nine sessions, two rounds, real code. I could not tell from where people clicked that they distrusted the chat. The clicks looked fine. Watching them go straight past it to the sources, and asking why, could: "I would not trust it because it's going through chat." Five of nine said a version of that. We replaced the chat with a direct view of the sources. Trust went from two of five to five of five in the next round, and the sessions halved from sixty minutes to twenty-five. One finding, and months of engineering in the right direction instead of the wrong one. Design Canvas, my own Mac app, April. Five founders on screen-shares in nine days. One said "I need this to exist." And then the onboarding failed inside the first sixty seconds, exactly where the strategy doc said it might. The same bug broke three sessions in a row. Demo mode went to the top of the list. Nobody would have told me that if I'd asked.
If you want a number.
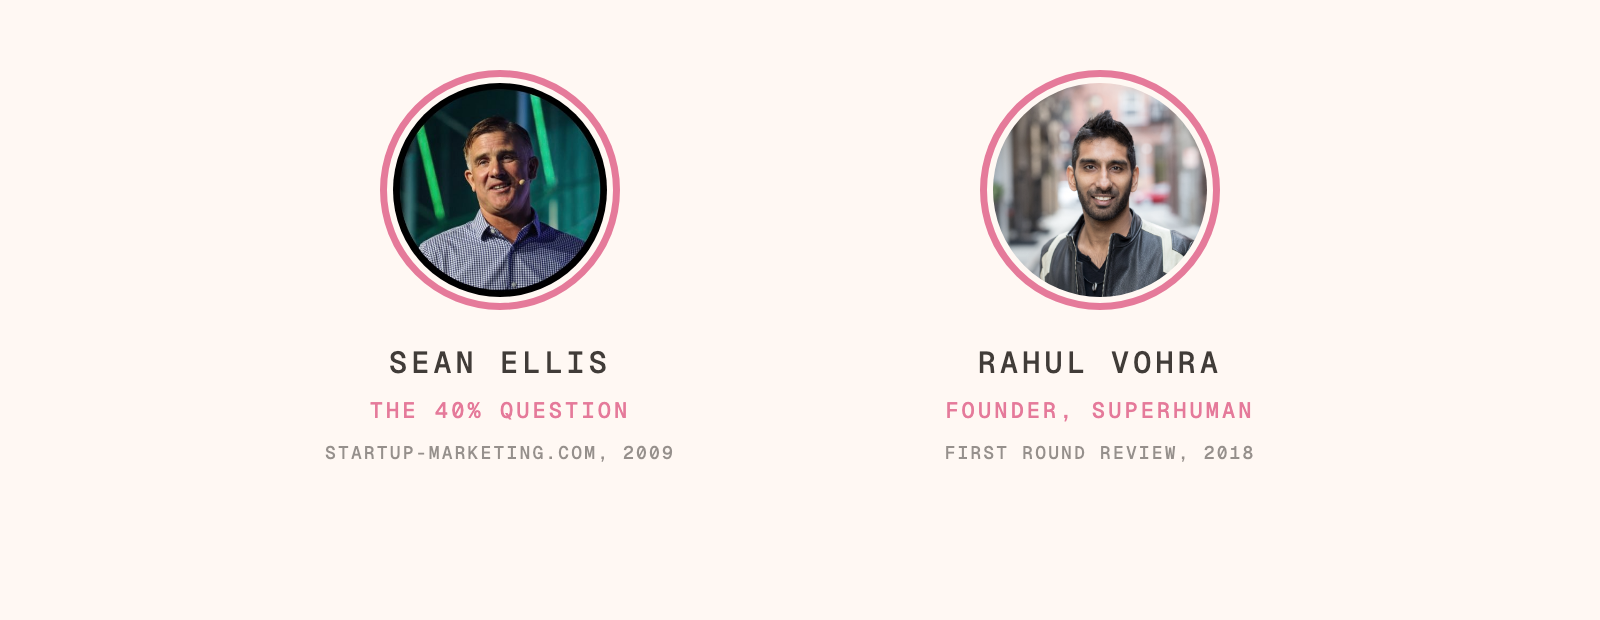
There is one question I'll allow, and it isn't "what do you want?" It's Sean Ellis's, the growth marketer who ran Dropbox's early growth and coined the phrase "growth hacking": how would you feel if you could no longer use this? Forty percent "very disappointed" is the bar. He set it after looking at a hundred and fifty companies.
Rahul Vohra, who founded Superhuman, the email app, wrote up how they used it. They started at 22%. Narrowing to the people who'd be very disappointed took it to 33%. Three quarters of building for those people took it to 58%. If you publish a score, publish how sure you are of it. Twelve people can't give you a percentage. They can give you a direction.
Then say what you're doing next.
Building is easy now. Knowing what to build isn't. Users still can't tell you what they want. They'll show you, if you watch.
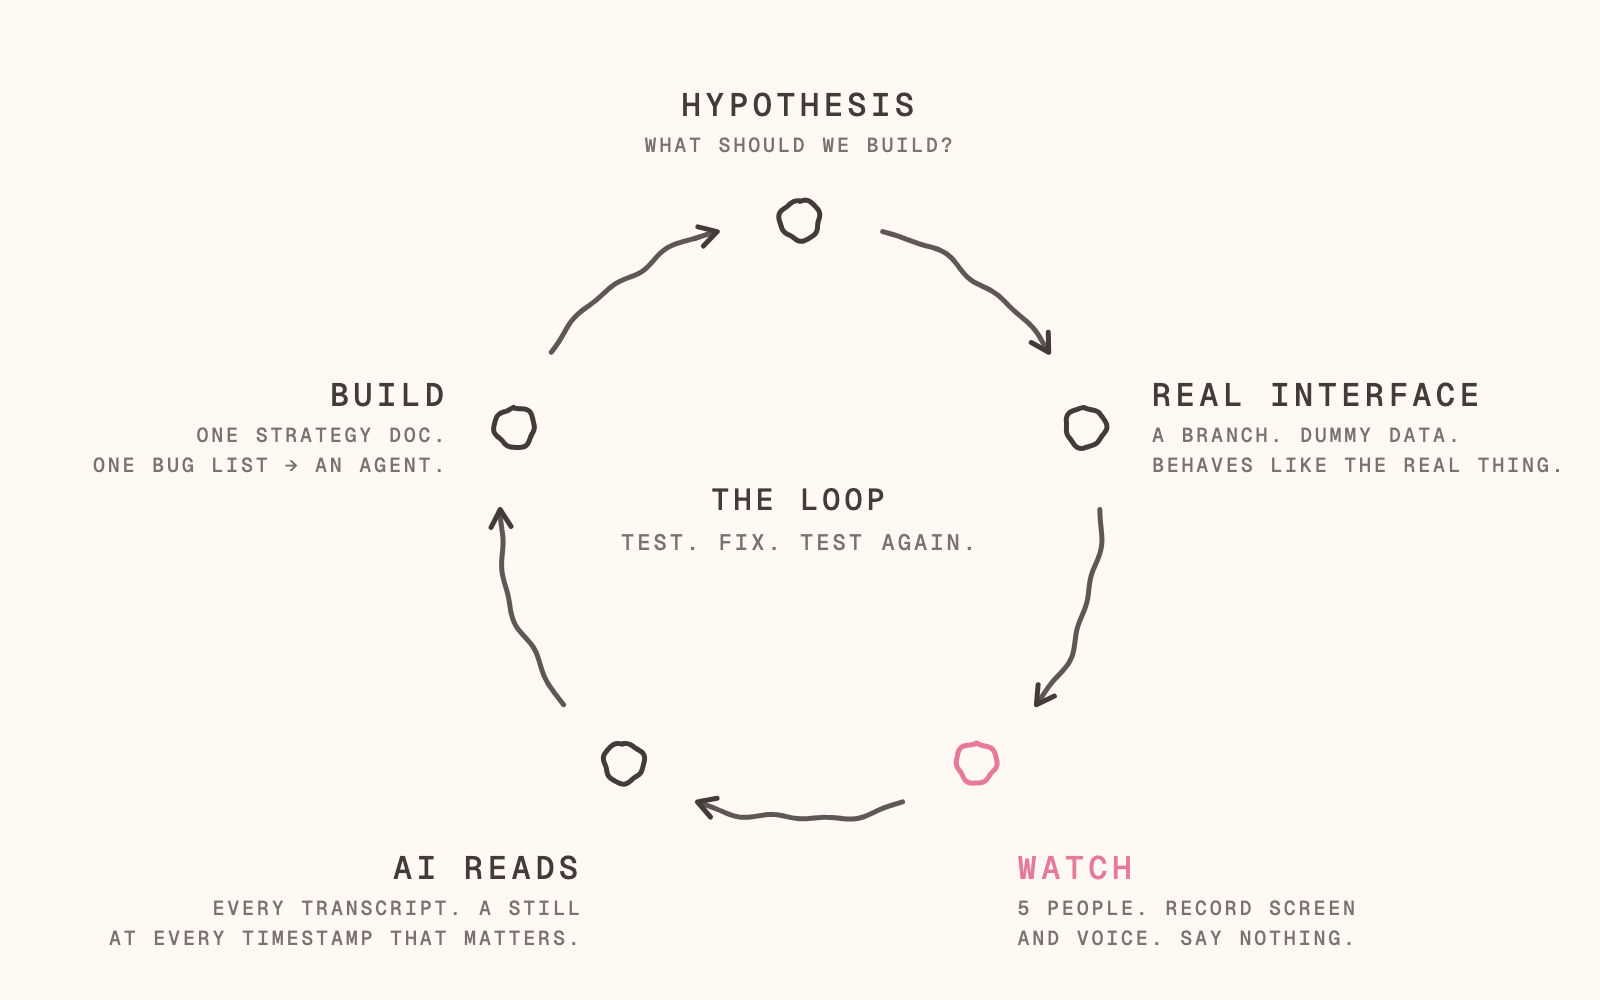
The rest is below: seven years of what testing found, and how to run a round in a day with AI. The kit I use is open source: user-testing-kit. Two shell scripts, three prompts, a staged example.
02 / Why people skip it
Why people skip it
I like building. Watching someone struggle with what I built is harder.
A famous quote makes a useful escape hatch. Read the surrounding sentences, though, and the permission to skip testing disappears.
Graham: get close
Paul Graham's advice is to spend time with the earliest users. Help them. Find out where the thing fails. The feedback comes from being there.
Rabois: distrust the explanation
Keith Rabois's objection is that people rationalise a purchase after making it. Ask why they bought the Porsche and you get a story. My reading: that is a reason to question the answer, and a reason to watch the behaviour.
Jobs: put something in front of them
The 1998 interview includes Apple's research into its existing customers. The objection is to designing through focus groups. Showing someone a working interface is a different test.
All three leave room for observation.
The Mom Test makes this practical: ask about a specific occasion in the past. Then, where you can, watch them do the task. A compliment is easy to give. A wrong turn is harder to explain away.
03 / What I’ve learned
What I've learned
The method has stayed recognisable. The work around it has changed.
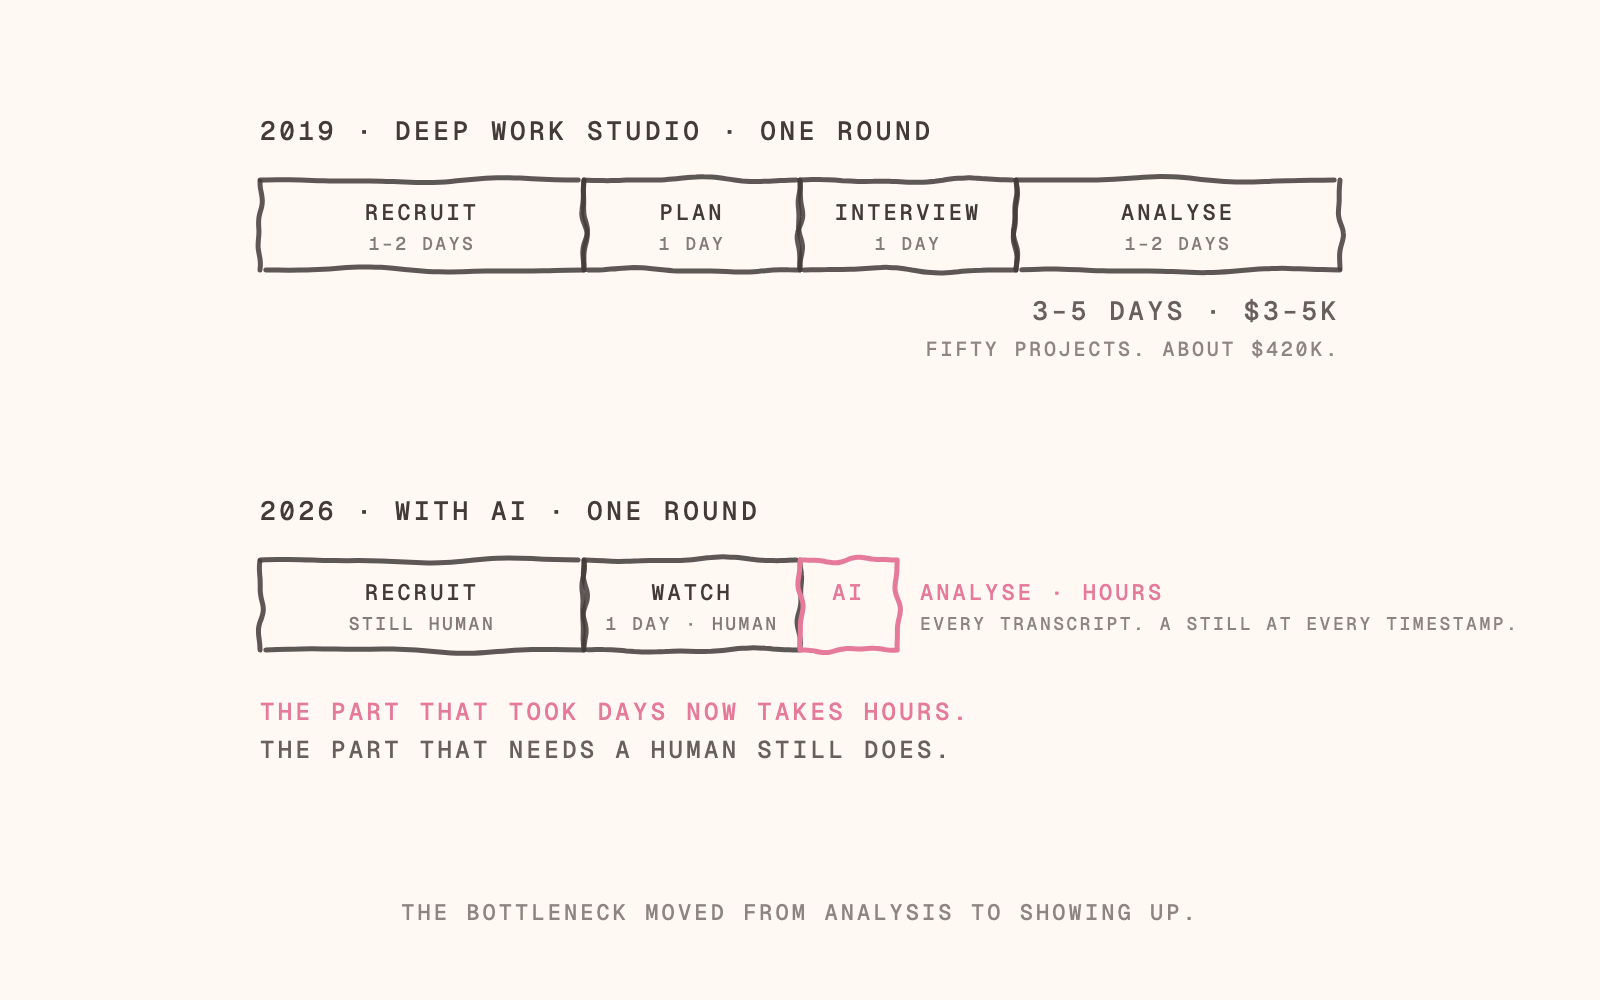
2018–23 · Deep Work Studio
More than fifty projects. At least five people testing each one.
A round took three to five days and cost $3,000–5,000. My published estimate for the studio's testing bill was roughly $420,000.
It changed what we built. Hummingbot's proposed graphical interface did not validate. Ethereum's validator launchpad needed people to slow down. Ramp's onboarding went through repeated testing and refinement.
The Deep Work case study covers the work.
January 2026 · Research Tech
Nine interviews across two rounds. Five of the nine preferred direct access to sources over chat.
We made the evidence easier to find. Sessions went from sixty minutes to twenty-five to thirty. One iteration day produced sixteen fixes and four larger overhauls, each linked to a user quote.
The Research Tech case study shows the resulting product.
April 2026 · Design Canvas
Testing my own app was less comfortable.
The need was there. Getting started was the problem. A repeated technical failure interrupted three consecutive sessions. Demo Mode became the first priority.
The Design Canvas case study is the next part of that story.
September 2026 · An accountancy practice
Eight recorded sessions in three days. Five fictional starting cases in a branch of the real product.
We catalogued 117 problems across onboarding and task management, alongside a list of 76 fixes. A separate 155-row audit of the task-management work found no missing problems in that register.
I wrote no session notes and read no transcripts. The agent did that part. The synthesis still needed checking: the audit caught a quote attributed to the wrong speaker and a supposedly unprompted finding that I'd prompted.
My rule was to leave fixes until after the interview. On the first morning, I'd broken it twice by 11:08. Fixing still feels easier than watching.
04 / Five things testing found
Five things testing found
Each started with an assumption. Each ended with a different build decision.
These are summaries of the work. Participant names and private recordings stay private; the public case-study images below show the products.
01 · Chat reduced trust
Hypothesis · An investor could use chat to explore an AI research report.
What we watched · Investors using Research Tech to inspect a company's evidence.
What we saw · Five of nine wanted direct source access. In the five-person scorecard, two passed the trust question initially; all five passed once they found the evidence. That is an observed task result, not a population estimate.
What changed · The evidence drawer became a direct view of sources, confidence and rejected material. Chat became optional.
02 · Slow them down
Hypothesis · The Ethereum validator launchpad needed a clear route through a difficult process.
What we watched · People working through the launchpad and the information needed before committing a deposit.
What we saw · Moving quickly was getting ahead of understanding. The testing showed that the details needed more attention.
What changed · We added deliberate friction so people had time to understand what they were committing to.
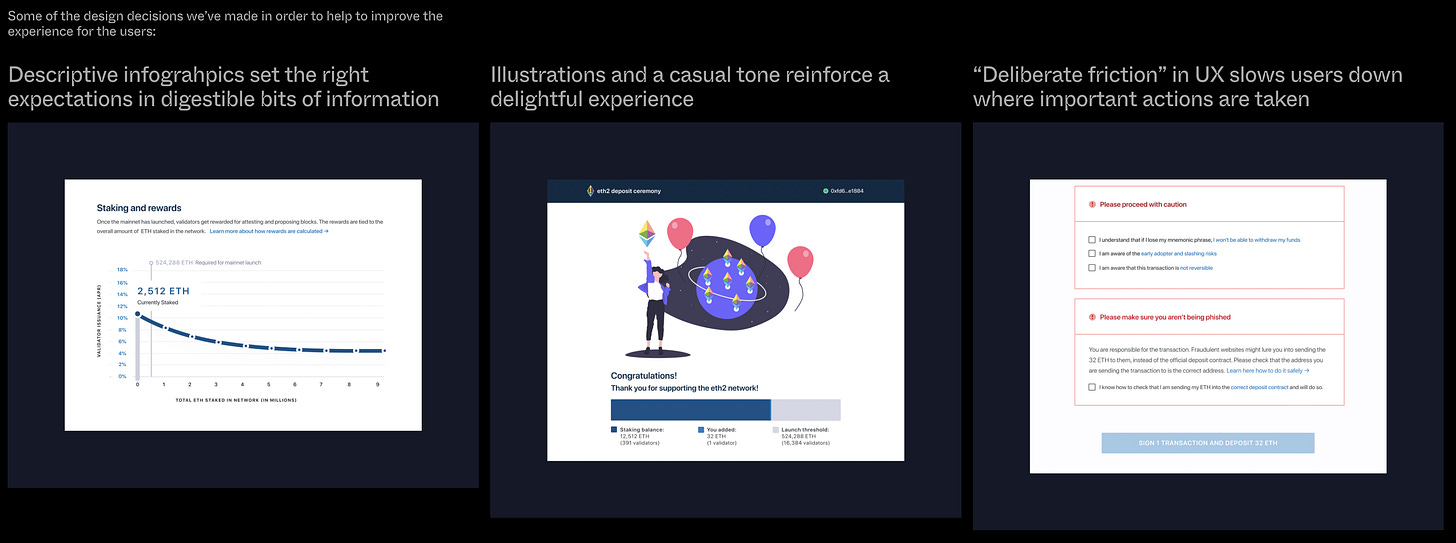
Ethereum validator launchpad · public Deep Work case-study image 03 · The first sixty seconds
Hypothesis · Design Canvas would help founders see and review what their coding agents had built.
What we watched · Founders trying the Mac app for the first time.
What we saw · One founder wanted it to exist, then struggled in the first minute. Interface vocabulary confused another. Separately, the same technical bug interrupted three consecutive sessions.
What changed · Demo Mode moved above sharing and export. Onboarding needed rebuilding. A crash and a confusing label went into different lists.
04 · The GUI nobody wanted
Hypothesis · A graphical interface over Hummingbot's command-line tool would be useful.
What we watched · Prospective users trying that proposed interface.
What we saw · The GUI proposition did not validate in testing.
What changed · We recommended against building it. The useful output was a build the team could avoid.
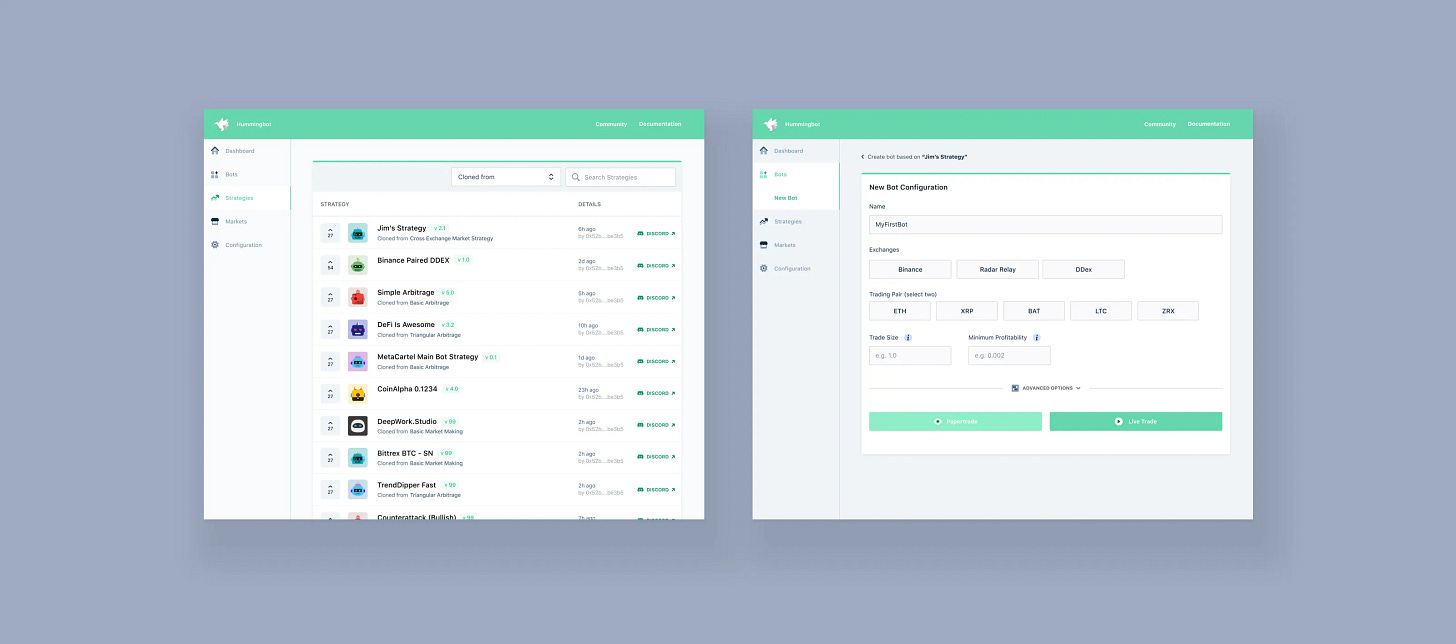
Hummingbot · public Deep Work case-study image 05 · The client was already done
Hypothesis · We needed to understand where onboarding stalled at an accountancy practice.
What we watched · Staff using the onboarding flow, alongside completion records for eighteen clients.
What we saw · Twelve acted within fifteen minutes of accepting. Median time to client completion was about four hours. The median wait from booking to the call was six days. Some completed cases still appeared to be in progress.
What changed · The plan added a clear finished state for clients and a staff board organised around who needed to act next.
The click was only part of the evidence. The decision came from understanding what happened around it.
05 / How to do it with AI
How to do it with AI, in a day
Have the people booked and the test interface ready first. Recruiting can still take days. The day is for watching, analysing and choosing what changes.
1. Write what would change your mind
Choose three questions. Give each a pass or fail condition. Map them to tasks someone can attempt on screen.
2. Make a safe copy of the real thing
Branch the product. Isolate its data. Use fictional cases with real behaviour, including the awkward states. Run through every task yourself, then reset it.
The kit's dummy-deployment prompt holds the brief.
3. Find five people who fit
Recruit for the problem you are solving. Record how closely each person fits your intended customer. A finding can be true for someone you are not building for.
4. Watch, and keep the recording
Get consent to record and explain where the recording will go, including any AI analysis. Give one task at a time. Let people think aloud. Leave room for silence and follow-up questions.
Keep both the screen recording and a timestamped transcript. Remove identifying information before sharing outside the team. Never publish a real client screen.
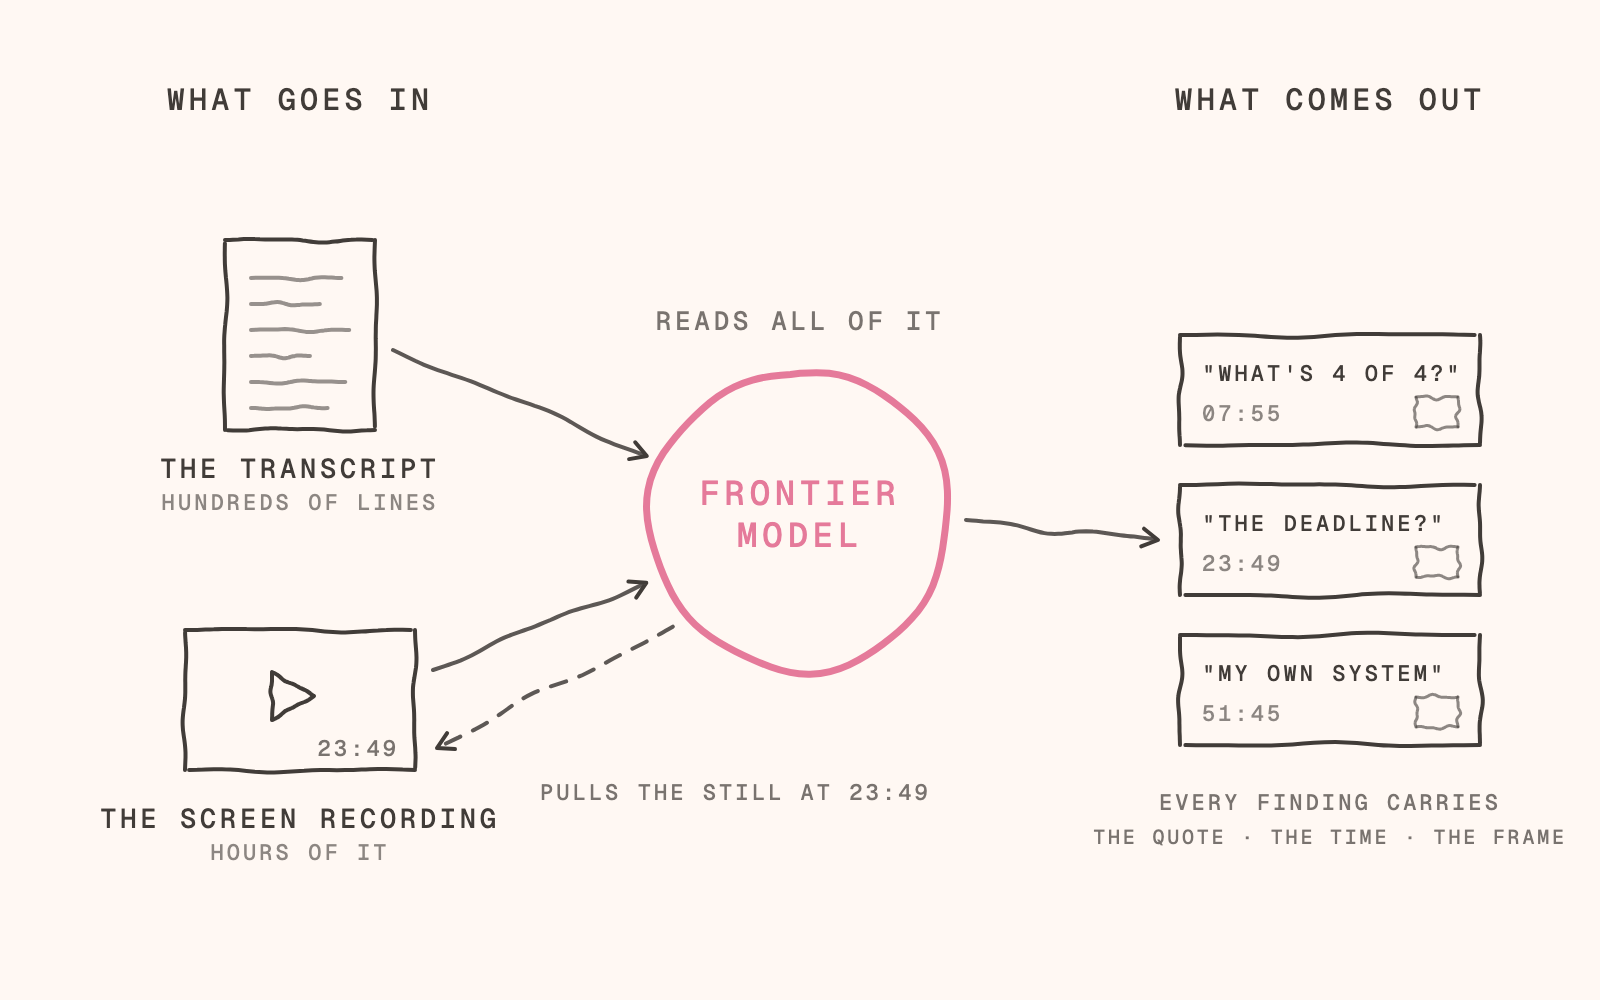
5. Give the agent both kinds of evidence
Start with contact sheets of the whole recording, then the whole transcript.
Measure the difference between the two clocks for each session. Choose the moments that matter. Pull the exact frames and check them.
The agent samples the screen. It does not watch the video continuously. Every finding needs a quote, a time and a frame; if one is missing, say so.
6. Separate decisions from fixes
The strategy read explains what the sessions mean. The bugs and small fixes give a builder work to do. The problem register keeps track of what happened to every finding.
7. Check, fix, repeat
Check at least three consequential findings against the recording. Verify every quote you publish. Check who said it, and whether you led them there. Keep technical failures separate from usability findings.
Fix what you learned. Test again.
The staged example shows the whole path. Its interface and participant are fictional.
06 / How many people?
How many people, really?
Five is a useful starting point for finding usability problems in one kind of user doing a defined set of tasks.
Nielsen's model assumes each participant has a 31% chance of finding a given problem. Move the slider to see the diminishing returns.
Try the model
A few people. A lot to fix.
1 − 0.69ⁿ · One user group, independent chances of discovery. A model, not a guarantee.
The model gives 84.4% at five users, usually quoted as about 85%. It is an illustration, not a promise about your next study. Rare problems and different kinds of users can need more sessions.
Enough to choose the next step
Five interviews can also help you decide what to build.
Michael Margolis helped develop research sprints at Google Ventures. His Bullseye Customer Sprint uses five carefully recruited target customers to compare three product concepts in individual interviews. The team revises the ideas and tests again.
If we’ve recruited carefully, we start hearing the same things over and over by the fifth session … Additional sessions have diminishing returns.
— Michael Margolis, Learn More Faster, p. 43; the method on p. 12.
If three people from the same target group independently reveal the same need, and you understand why it matters, you have a direction worth testing. Check why the other two responded differently. Then make the smallest change that tests what you’ve learned.
At Research Tech, watching people seek original sources helped change the product direction. Direct access to evidence became central; chat became optional.
That is a practical rule for the next experiment, not proof of what most customers want. More interviews can still teach you something. But when the evidence supports a clear next step, trying it may teach you more than another round of the same questions.
Fix between rounds
Nielsen's recommendation is three rounds of five, with a redesign between them. The later rounds test the changes. Fifteen people seeing the same broken interface cannot do that.
Finding and measuring are different jobs
NN/g's guidance distinguishes qualitative testing from quantitative measurement. For the latter, it recommends at least twenty participants; tighter intervals need more. Different user groups need their own coverage.
Analytics helps you locate a drop-off. Watching someone gives you a chance to understand it and ask a follow-up. Use both when you have both.
07 / Measure it
Measure it
Sean Ellis's question asks how people would feel if they could no longer use the product. His benchmark was 40% answering “very disappointed”, drawn from looking at about 150 companies.
That benchmark can guide a decision. It cannot certify a business.
At Superhuman, the score started at 22%. Changing the segment took it to 33%. Three quarters of product work took it to 58%. The first change was who counted; the second followed work on the product. Report that distinction.
Put the sample beside the score
This calculator starts with an illustrative five of twelve responses. It is not a score for any of my products. Enter your response counts to see a Wilson 95% confidence interval.
Try your own counts
How sure is that score?
The interval crosses 40%. The sample leaves room on either side of the benchmark.
Illustrative starting values. Your entries stay in this page; nothing is submitted or saved.
| Responses | Very disappointed | Score | 95% interval |
|---|---|---|---|
| 12 | 5 | 42% | 19–68% |
| 12 | 6 | 50% | 25–75% |
| 20 | 8 | 40% | 22–61% |
| 50 | 20 | 40% | 28–54% |
| 100 | 40 | 40% | 31–50% |
The interval describes sampling uncertainty under a binomial model. It does not correct for the wrong audience, people who chose not to answer, or a leading question. It is not a 95% probability that the product has found product-market fit.
Publish the counts, who you asked and how you recruited them. Then say what you are changing and when you will ask again.
08 / Try it yourself
Try it yourself
Fork the user-testing kit. It is open source, under the MIT licence. You need ffmpeg, a recording, a transcript and a coding agent that can run commands and look at images.
Start with the staged example. Then use your own sessions. Keep the raw evidence private.
The kit keeps the working files together:
- Three prompts: dummy deployment, strategy read, bugs and small fixes.
- Two scripts: contact sheets and frames at a timestamp.
A Zebra Sprint follows this loop: hypothesis, prototype, test, iterate. If you would like help with one, reply to the letter or book a Zebra call.
Follow the build in the letter.
The next useful thing may be someone getting stuck. Leave enough silence to see it.